#TradeIdea XAGUSD Outlook! On the H2 chart for XAGUSD | FBS Analytics
#TradeIdea
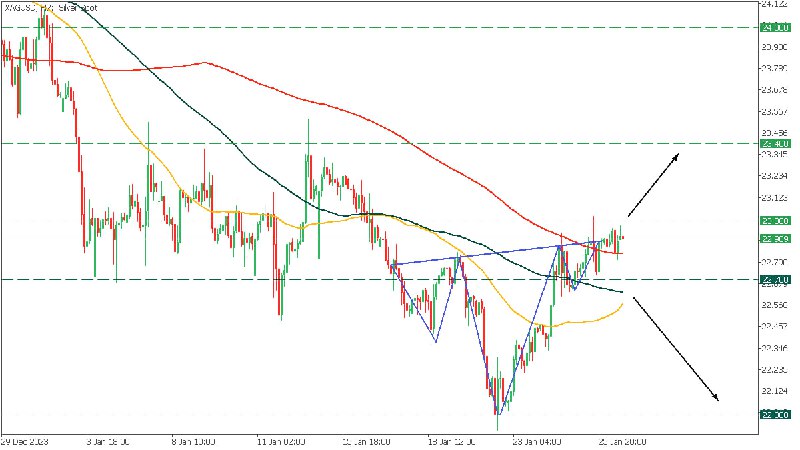
XAGUSD Outlook!
On the H2 chart for XAGUSD, a "head and shoulders" pattern has formed. A breakthrough of the resistance level at 23.000 is a good signal for a bullish trend.
If the price surpasses the resistance level at 23.000, the next target will be 23.400. However, if the price declines below 22.700, it will pave the way to the support level 22.000.
Are you bullish or bearish on XAGUSD? Share in the comments
Market news & trade ideas & analysis and more by FBS team. FBS Support: @fbs_official_bot. More analytics: https://bit.ly/3Ux0pMT. Start trading with FBS: https://bit.ly/3vmgYB2. Channel rules: https:...