#TradeIdea NZDJPY Analysis! In the H1 timeframe, NZDJ | FBS Analytics
#TradeIdea NZDJPY Analysis!
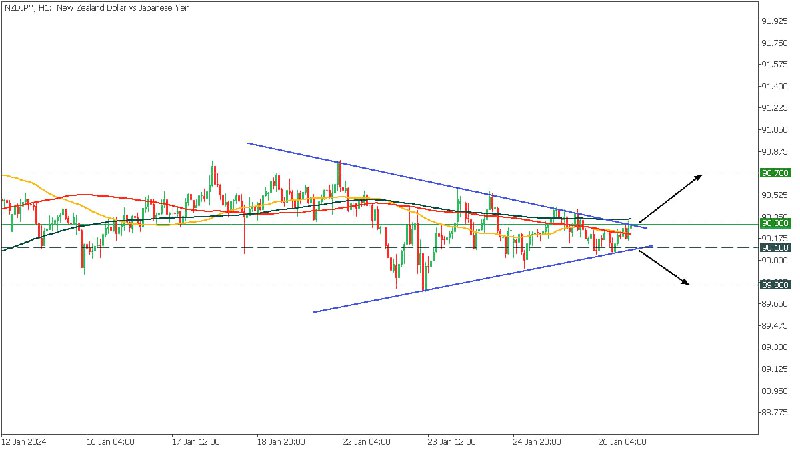
In the H1 timeframe, NZDJPY has formed a symmetrical triangle pattern; the moving averages are concentrated in a narrow range, so two options are possible:
If the upper trendline and resistance of 90.300 are broken, the price will soar to the 90.700 level If it falls below the support level of 90.100, NZDJPY may reach 89.800
Are you bullish or bearish on NZDJPY? Share your thoughts in the comments
Market news & trade ideas & analysis and more by FBS team. FBS Support: @fbs_official_bot. More analytics: https://bit.ly/3Ux0pMT. Start trading with FBS: https://bit.ly/3vmgYB2. Channel rules: https:...